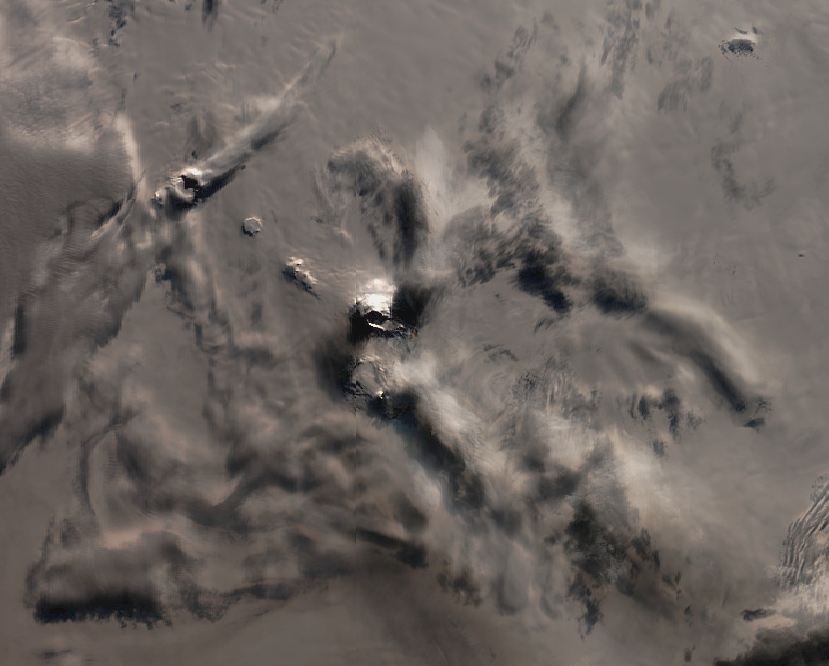
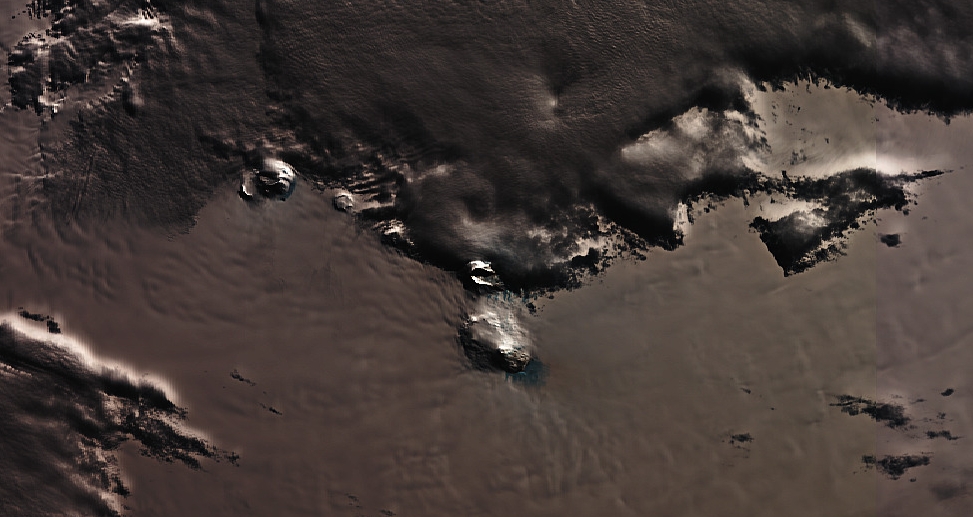
Labels 2021-01-20-1208-38-S3B_320deg Executive Committee Volcano Range. Created by Mark Drapes 24.1.2021. Original image from Sentinel 3, Copyright 2021 Copernicus.eu
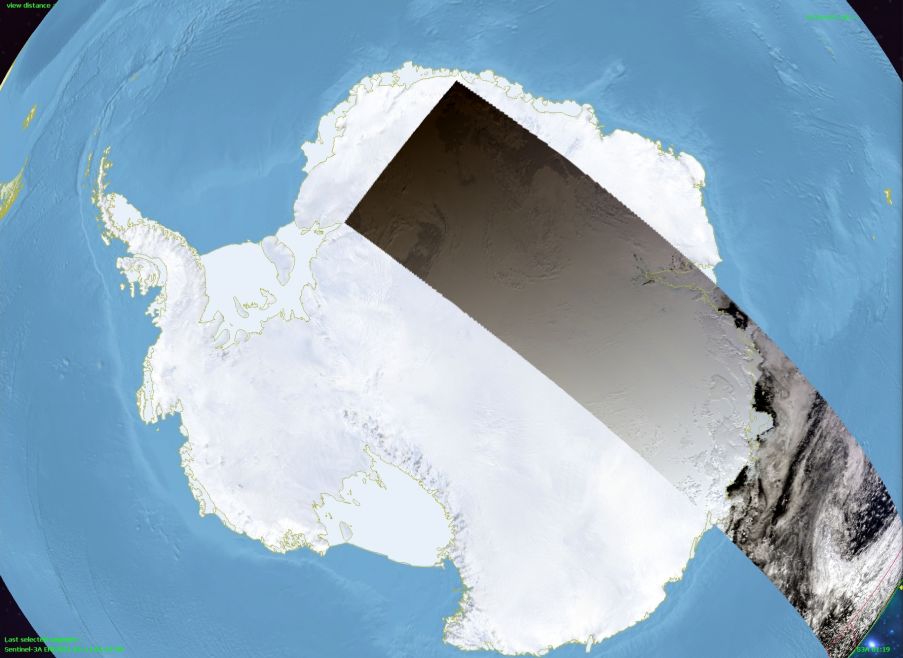
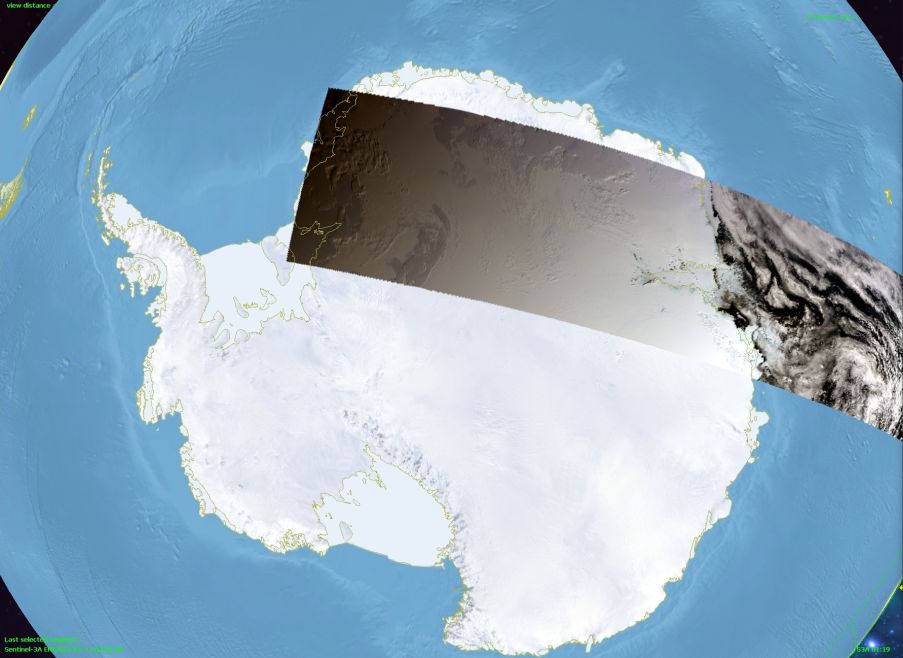
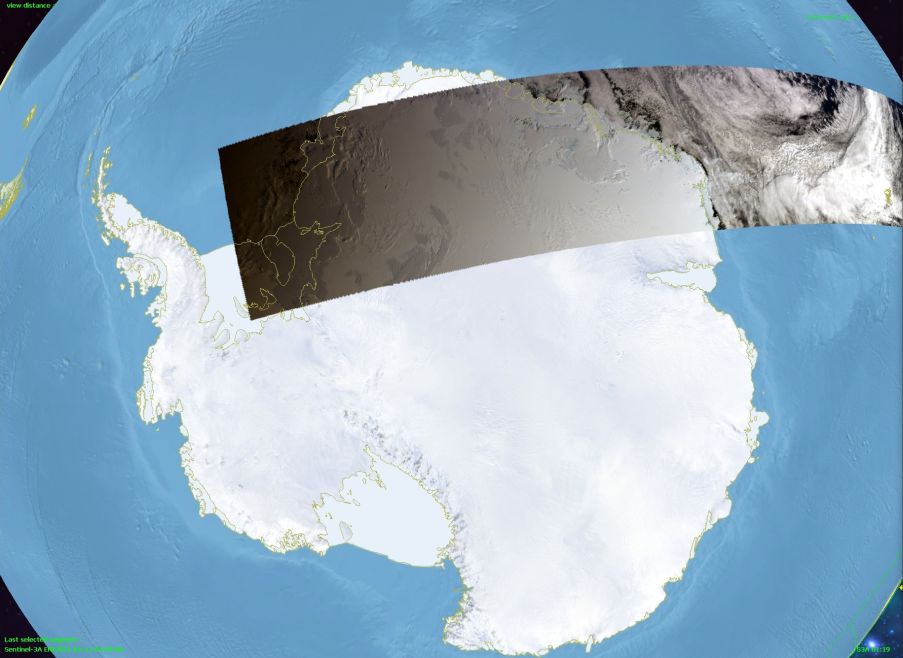
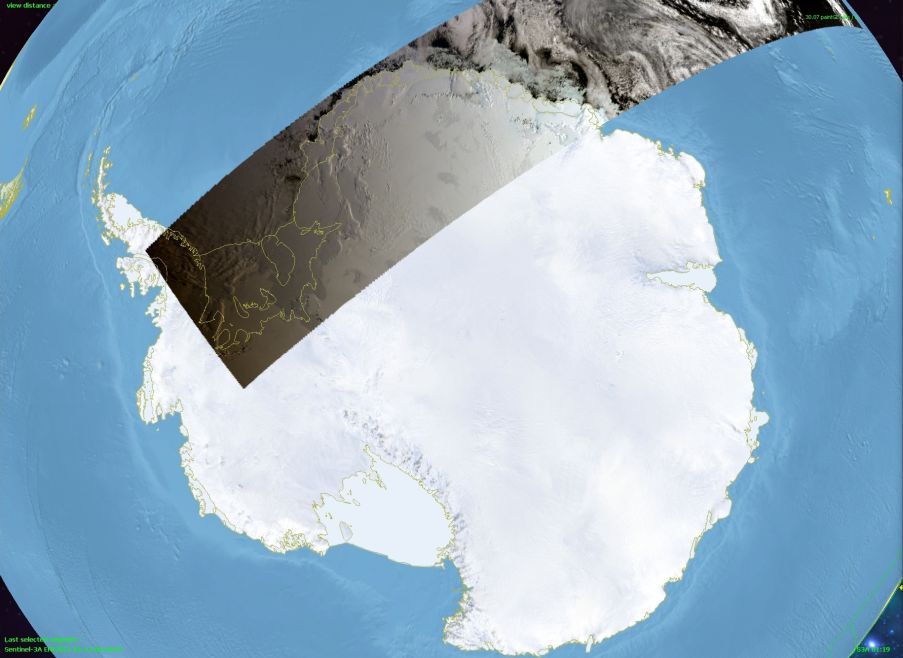
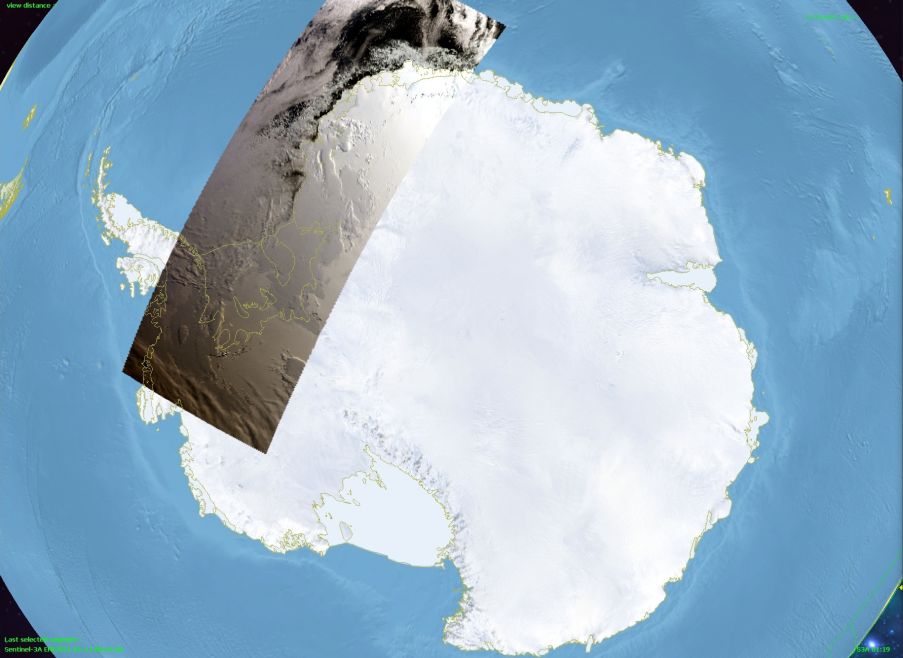
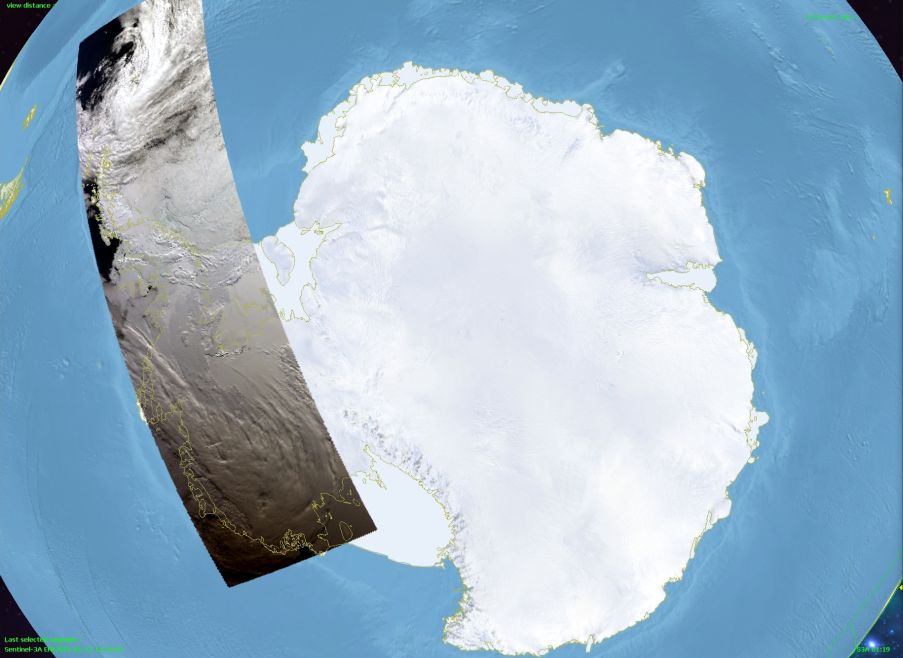
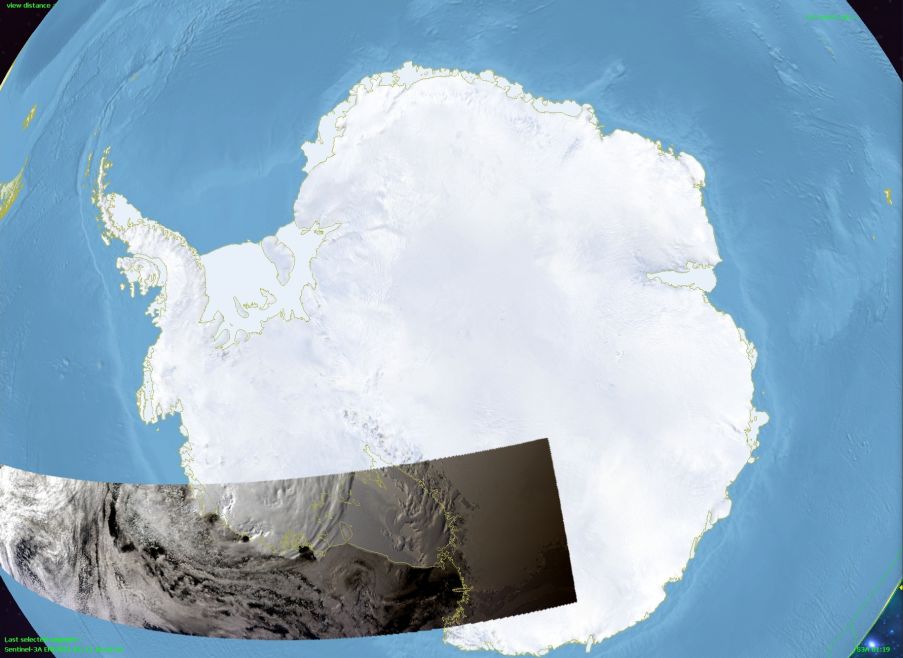
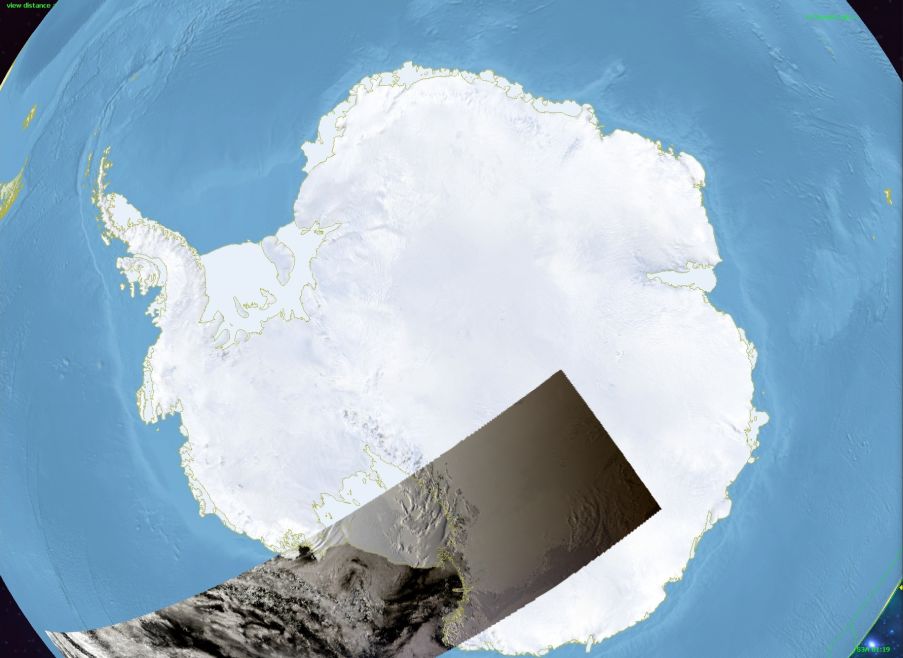
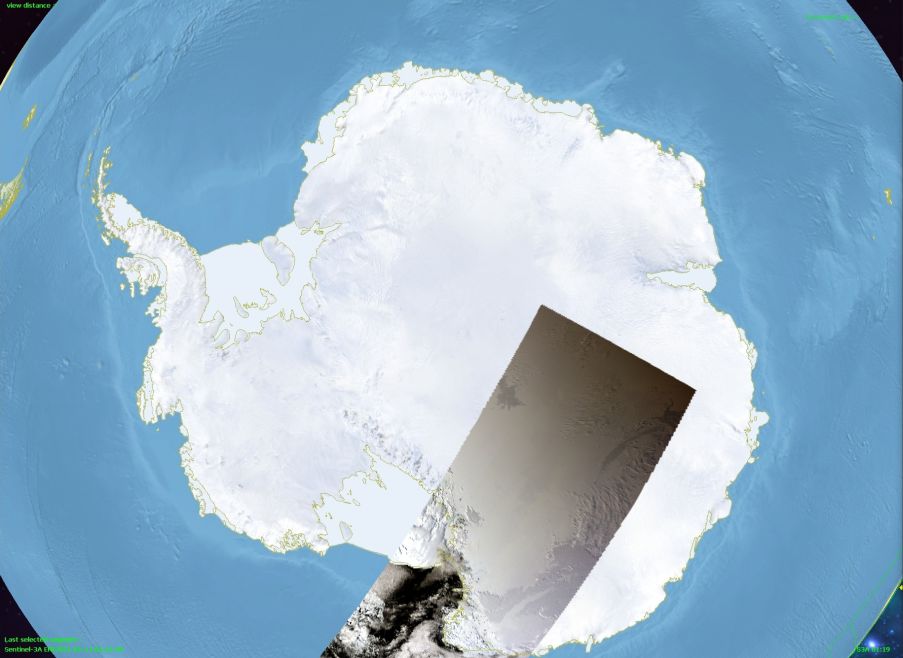
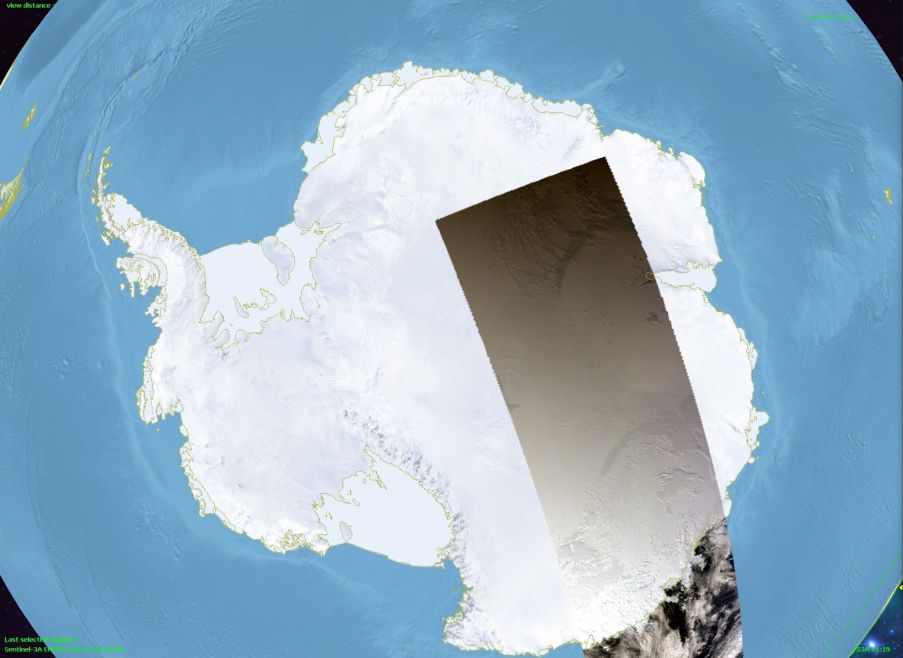
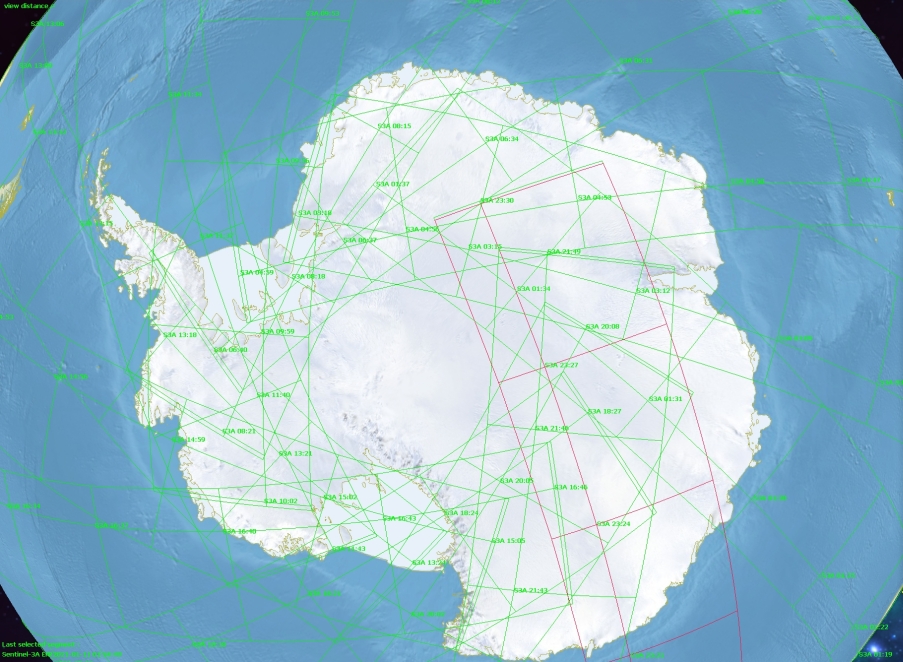
Sentinel 3A passes over Antarctica. 2021/01/11. To illustrate coverage. The images are from the OLCI (Ocean Land Colour Imager) instrument , the swathe width is 1270km, resolution 300m. The images can be downloaded from https://scihub.copernicus.eu/dhus/#/home after registering.
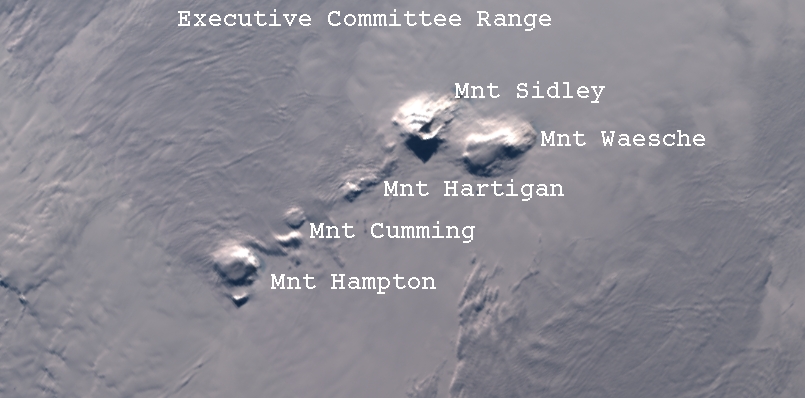
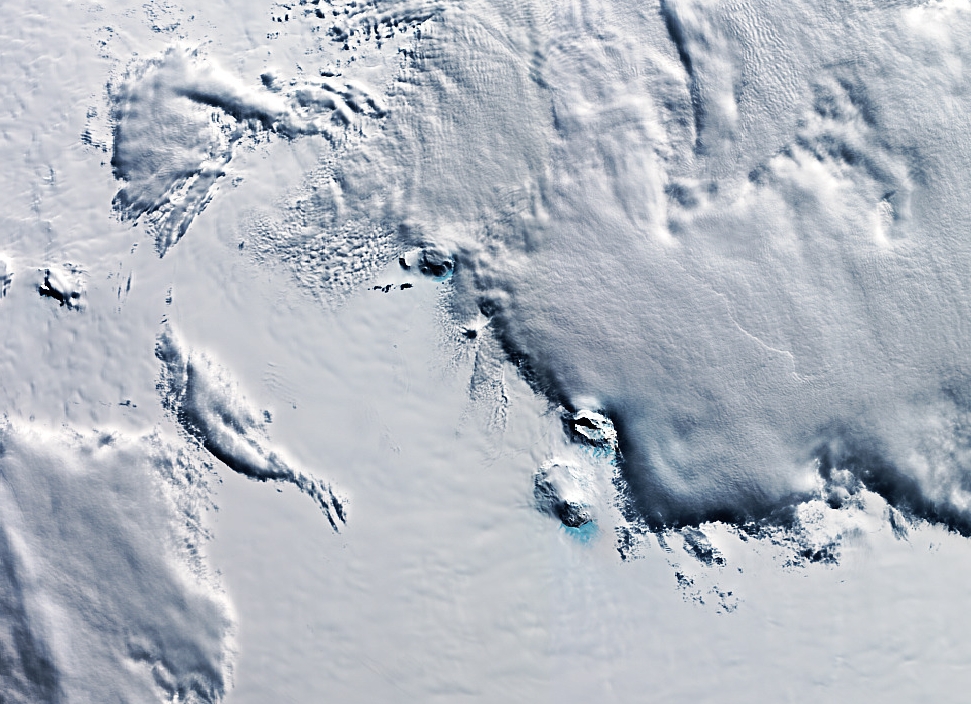
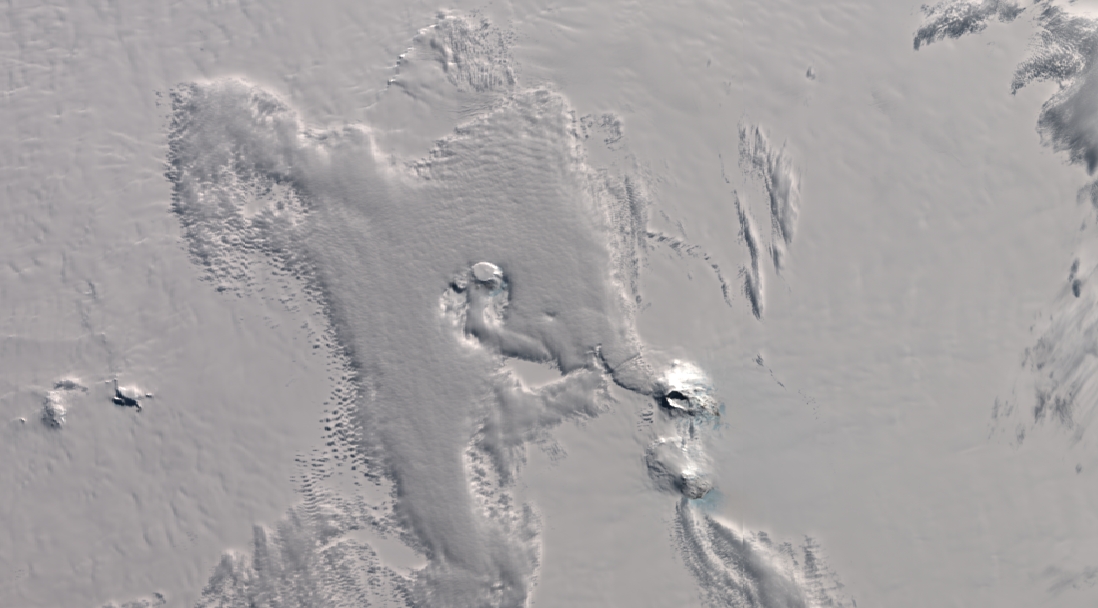
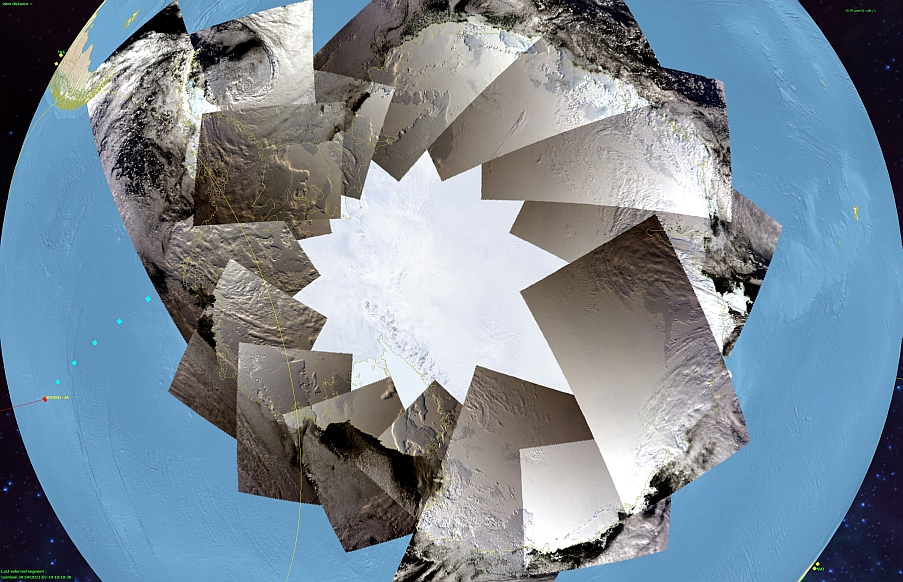
Created by Mark Drapes 17.01.2021 using satellite images from Sentinel3A, copyright 2021 copernicus.eu
Processed in Eumetcastview. http://hvanruys.github.io/
and Gimp.
2021.01.11:09.53 Sentinel 3A Pass 06 not saved
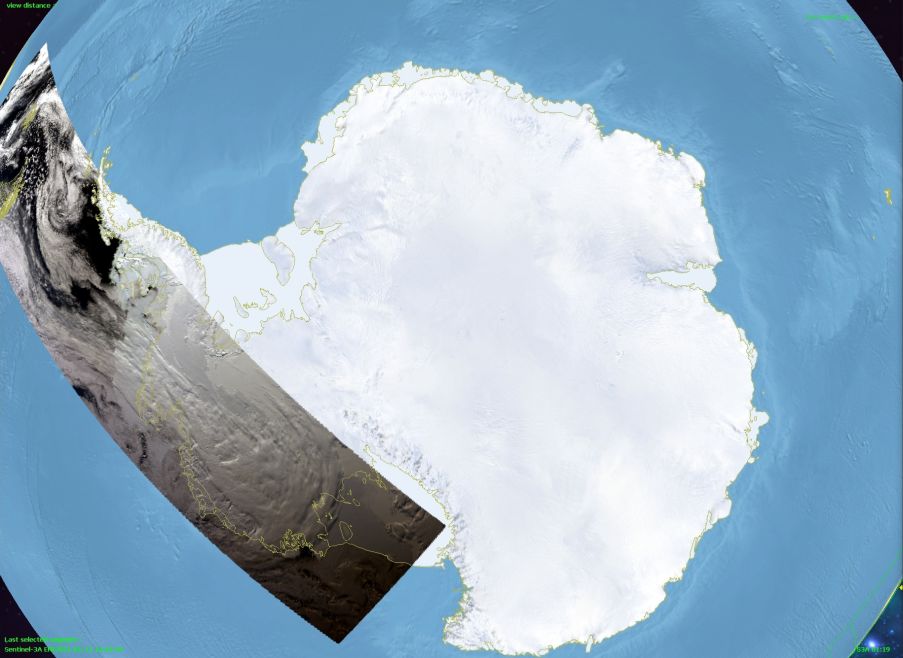

2021.01.11:14.56 Sentinel 3A Pass 09
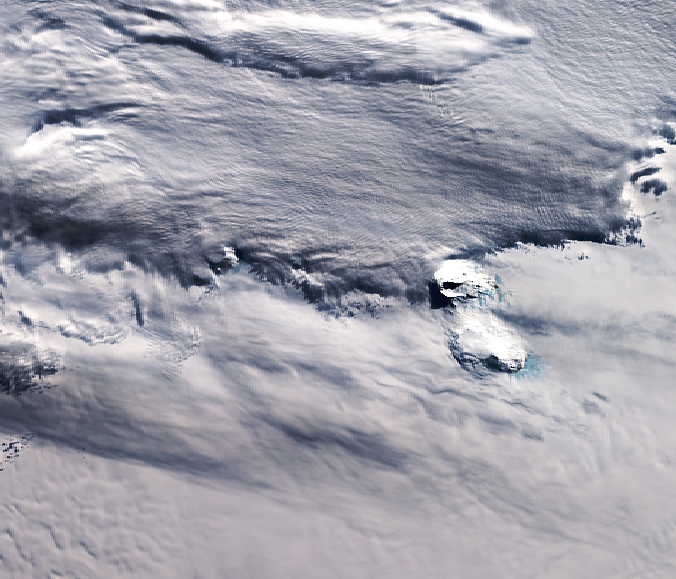
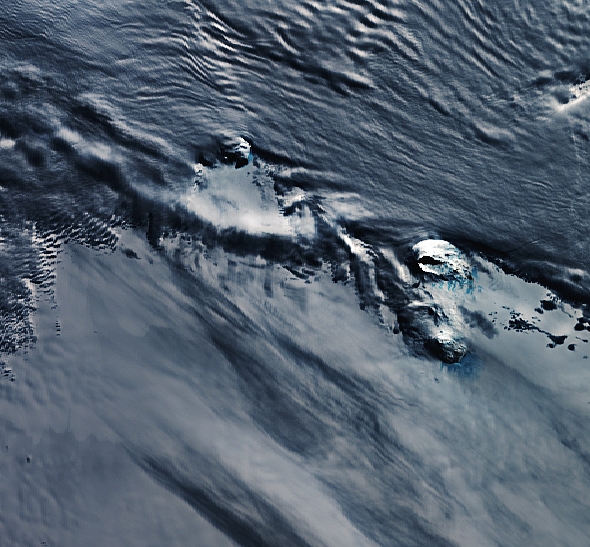
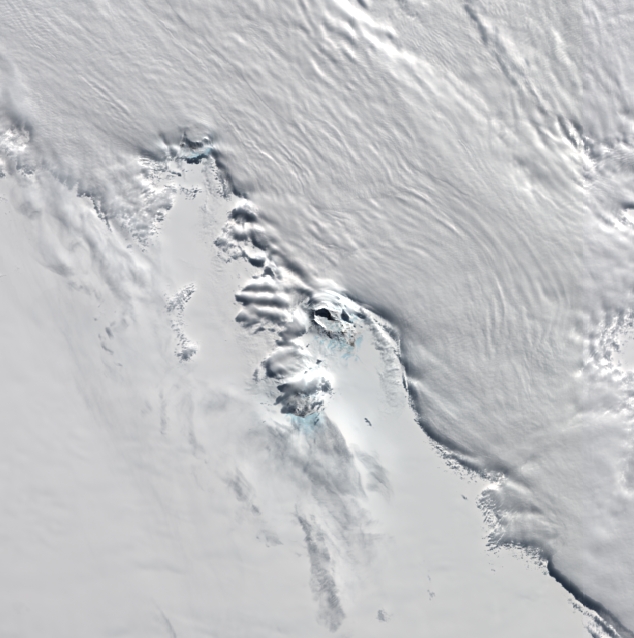
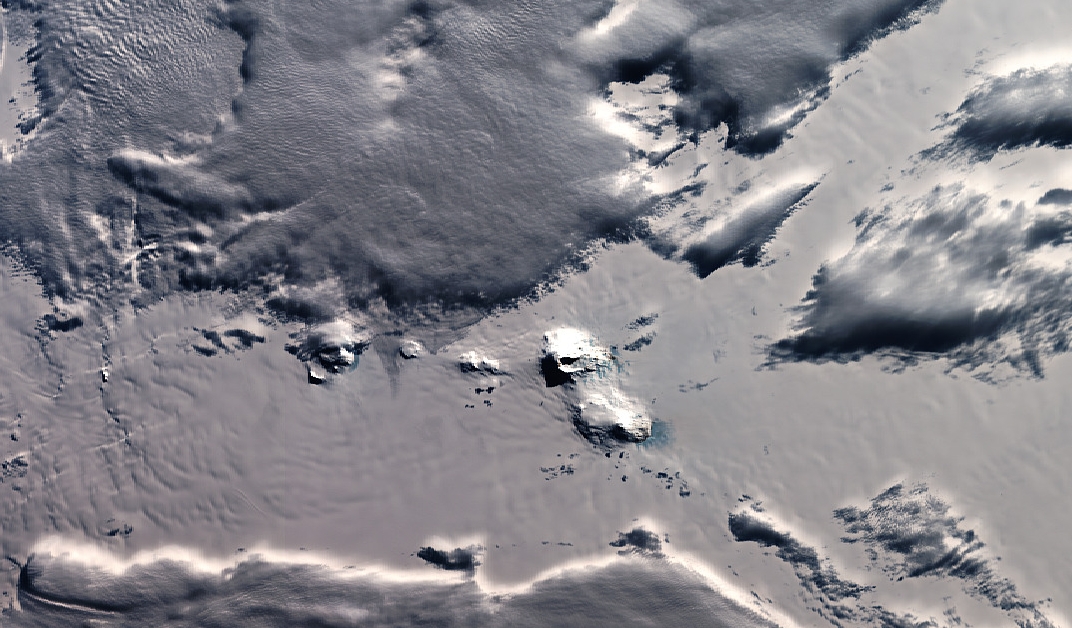
Geothermal Volcano-Related Activity in Antarctica
Looking at Eumetsat's Metop satellite infrared images from the antarctic area every day sometimes you see dark low level clouds or a high level steam plume emanating from a single point. If a 2nd and 3rd pass show similar clouds from the same point its probably not a random cloud effect. If you then look up the latitude and longitude of this source of cloud, sometimes it coincides with a volcanic peak. For many years I have been studying Metop, Modis and Sentinel satellite images of Antarctica. I would conclude that there is quite a lot of geothermal and mild volcanic gas emissions in western antarctica but most of it goes unnoticed or at least does not seem to get in the news very much. The metop satellite is able to look at a 3000*1000km swathe every few hours (also in the winter darkness period using infrared). Its a shame there are no webcams watching the antarctic volcanoes like there are in Indonesia.
The most notable hot gas or steam emission I came across was from Mount Siple on 20th June 2012, the plume grew to 300km long. It shows up on 4 consecutive Metop passes. Also in the thermal image you can see the volcanic cone shows up as a circle that is a 6+ degrees warmer than the surrounding area:
073S 126W Mount Siple, Siple Island, Antarctica
For weekly reports of observations of volcanoes from around the world: https://volcano.si.edu/
With plumes you can also get similar wind shadow effect when strong low winds blow over the flat plains and sea ice of the antartic and are disturbed by tall mountain peaks like Siple. Sometimes this effect creates wave patterns in the clouds - the so called Gravity Wave Effect which you see at the north and south poles.
Hawaii university has a global volcanic hot spot monitoring websites. But it does not seem to register Antarctica emissions as hot gas and smoke is instantly frozen and water condenses on it by the surrounding air which is -20 to-50degC. The hotspot monitoring seems to be set up to detect the more dangerous final phases of volcanic activity when lava and ash are coming out of the cone. It works well in Indonesia or Hawaii when you have ambient temperatures of +10 to +35degC. http://modis.higp.hawaii.edu/
There are lots of interesting areas to investigate in and near the antarctic rift areas including:
76s112w_Mount_Takahe_antarctica
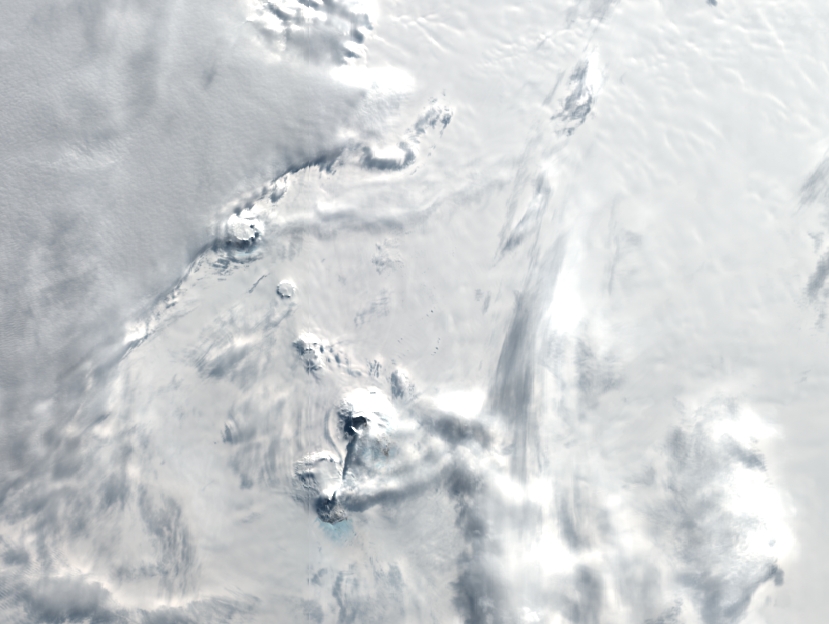
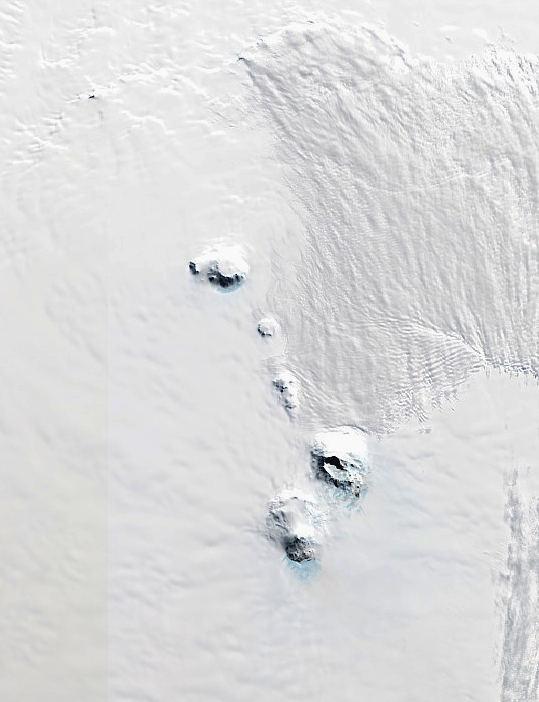
The Executive Committee Range of Volcanoes
The Flood Range of Volcanoes
Site updated 20210124